


1.Global Coffee origins and destinations
Where does coffee come from, and go
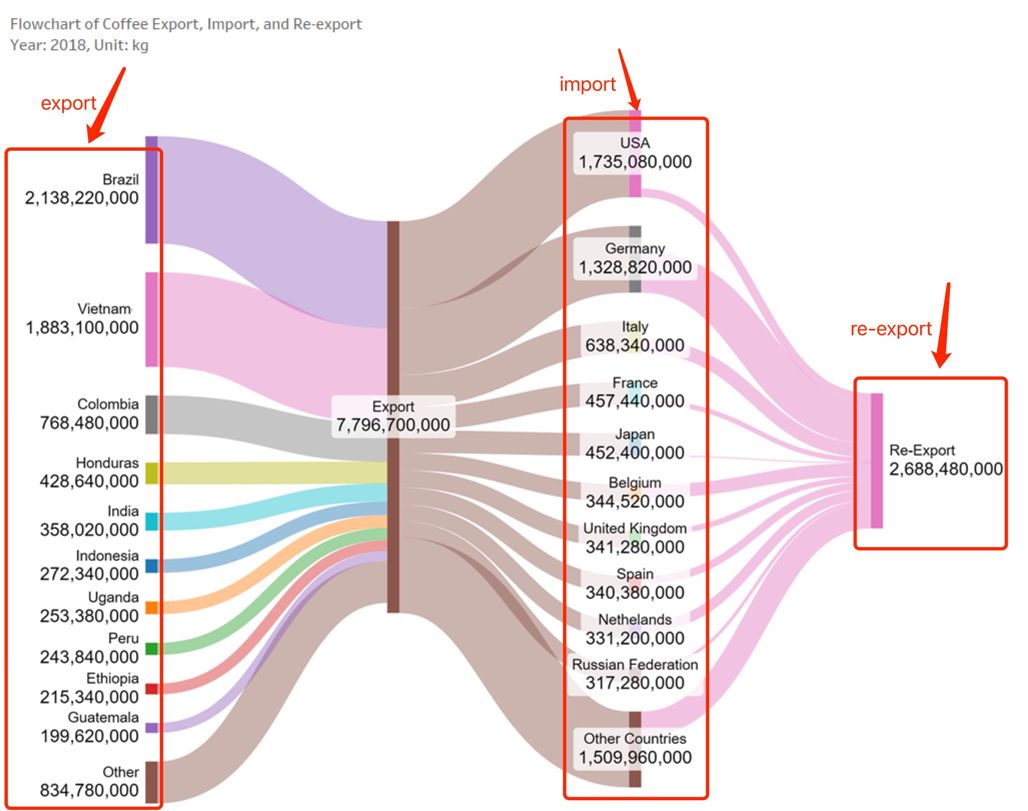
Coffee Export:
Brazil is the country with the largest coffee export. Although there are several countries exporting coffee, such as Colombia, India, and others, none match the export scale of the main exporters found in two different regions. Non-surprisingly, we find in South America, Brazil, is a main exporter. Vietnam, which might be more surprising, due to its country size, stands out as the main exporter for the Asian side.
Coffee Import:
As the following figure illustrates, coffee is a commodity product mainly being imported into transatlantic coffee hubs. The latter reference alludes to the dense regions that import coffee. As such, we have two outliers, being the United States and Germany. The top 5 import countries are: The United States, Germany, Italy, France, and Japan.
Coffee Re-export:
The fact that Germany is the largest re-exporter corroborates the economic situation at the time. Germany, in particular, was experiencing economic growth, which translated into imports of coffee for subsequent re-export.
To trace how coffee exports have evolved over time, we can look at historical data from 1990 to 2018 of the current top 3 coffee exporters:
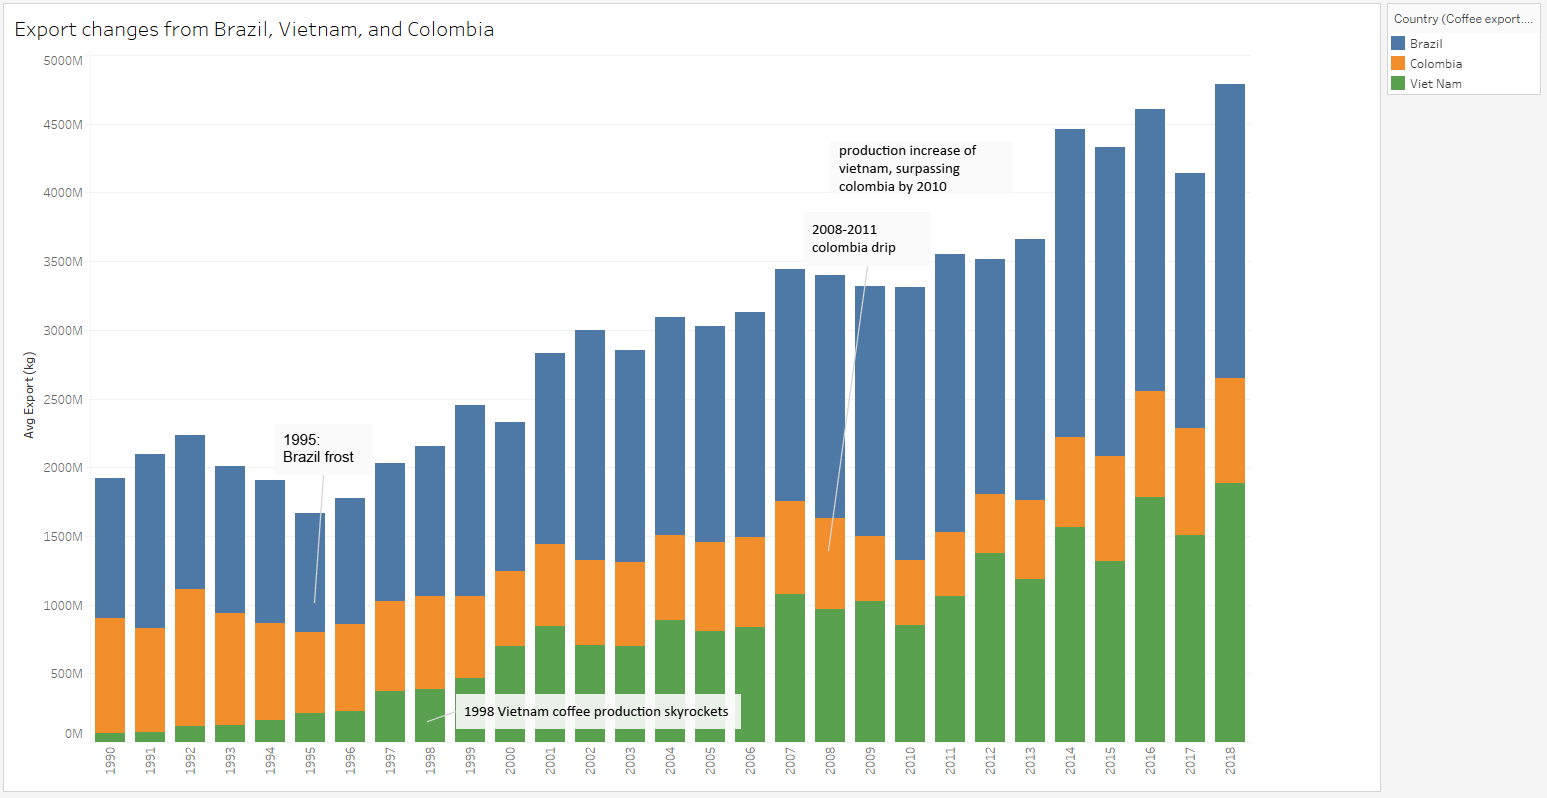
This graph shows the coffee export trends of Brazil, Vietnam, and Colombia from 1990 to 2017, highlighting Vietnam's dramatic production surge starting in 1998, which allowed it to overtake Colombia by 2010. Meanwhile, Colombia faced declining exports between 2008–2011, likely due to challenges like coffee rust disease and market shifts.
2. The Cup: Consumption of coffee
Surprisingly, the top consumers of coffee are not the major producers. While countries like Brazil and Vietnam dominate exports, the highest daily coffee consumption is found in entirely different regions. The next graphs highlight daily coffee consumption across continents and key countries.
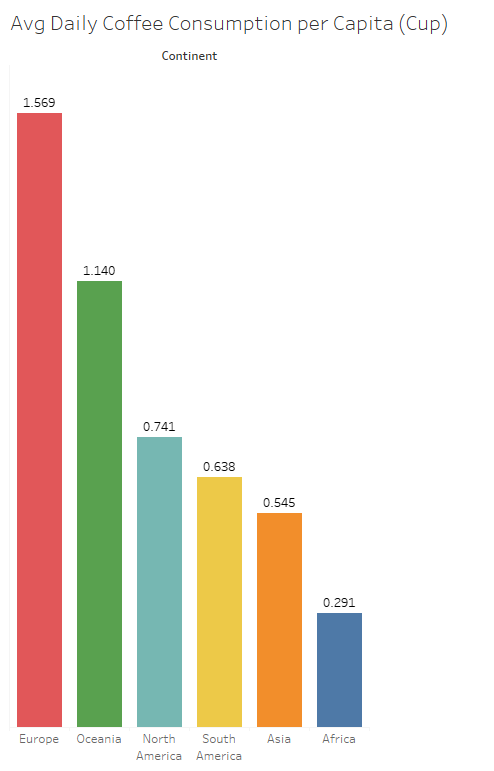
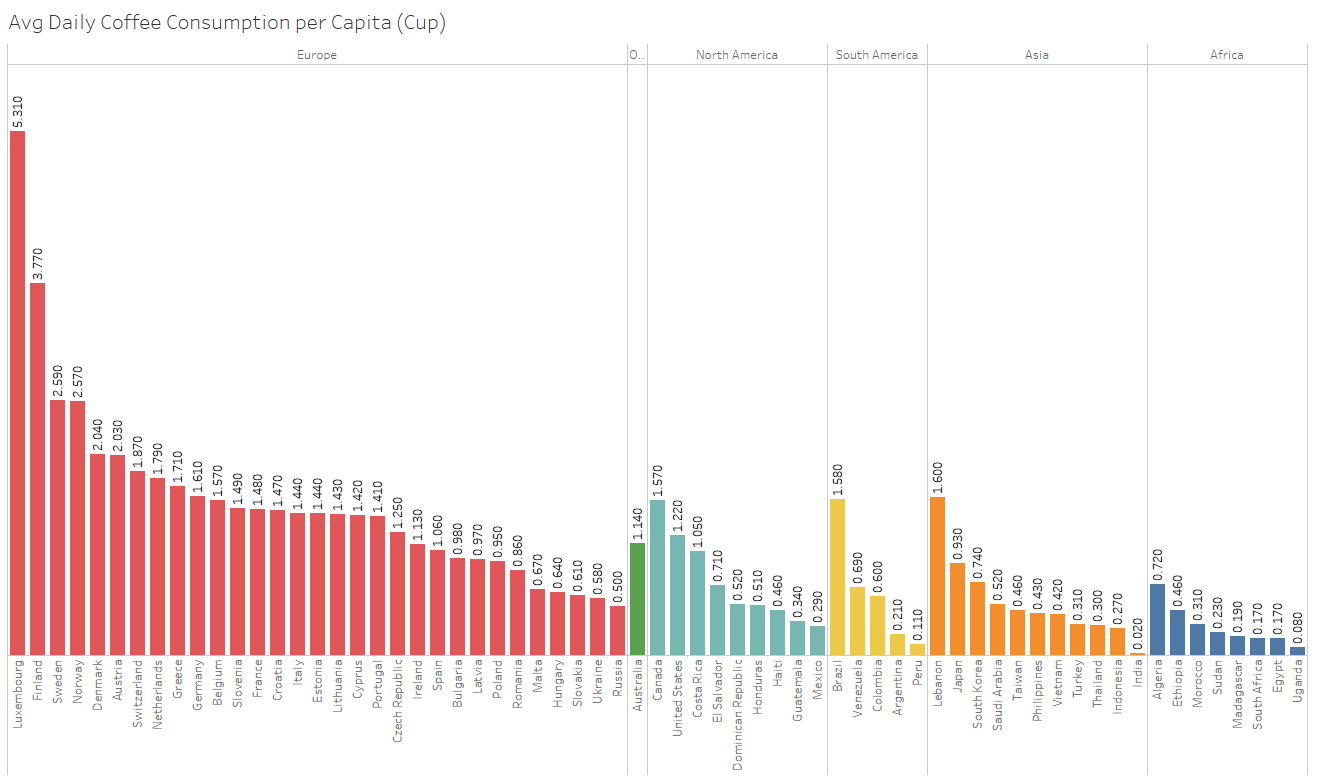
Europe, as a continent, ranks among the highest in daily coffee consumption, which is consistent with the fact that many European countries are major importers of coffee. However, a closer country-level breakdown reveals nuanced disparities — for example, Nordic nations like Finland, Sweden, and Norway significantly exceed the European average.
Despite being the top importer and not one of the main re-exporters, coffee consumption per capita in the USA is lower than that of many European nations. This is largely due to the difference in population size, indicating that although the U.S. plays a major role in the coffee trade, its per-person consumption does not reach the high levels observed in Europe.
3. Possible Causes of Variations in Coffee Consumption
From the previous graphs, we observe that coffee consumption varies widely across continents and countries. In this section, we delve deeper to explore how coffee consumption relates to other factors.
3.1 Adjusted Price
To remove the effect of varying GDP levels among countries and reflect the relative affordability of coffee in each country, we normalised coffee prices by dividing them by each country’s GDP per capita index, where the GDP per capita index is defined as the country’s GDP per capita divided by the average GDP per capita across all countries.
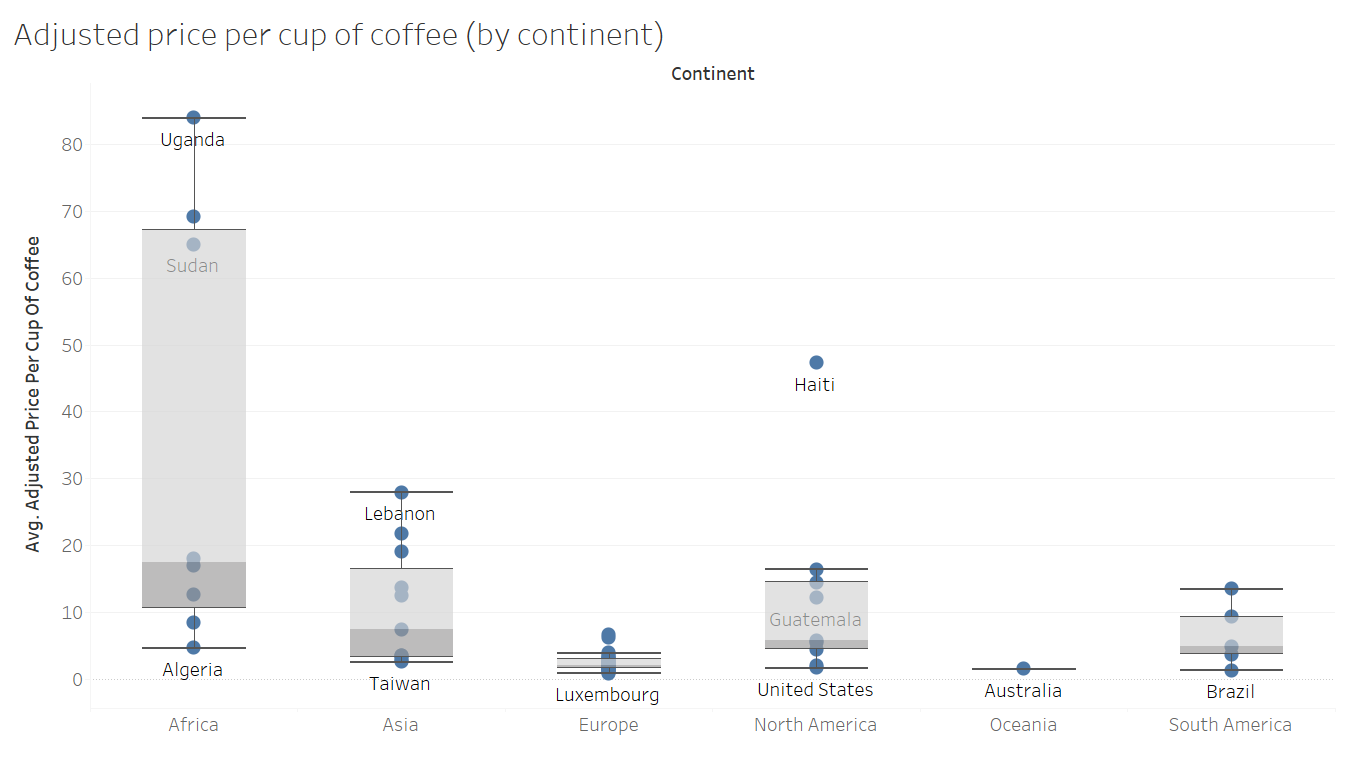
When examining regional patterns, some clear trends emerge.
Coffee is the least affordable in Africa, with Uganda reporting the highest adjusted price at $83.96, meaning that the cost of a single cup of coffee represents a disproportionately large share of the average citizen’s income.
In Europe, coffee prices tend to be more stable, with relatively little variation between countries. In contrast, regions like Africa and Asia exhibit much greater variance in coffee prices between countries, highlighting uneven levels of affordability across these continents.
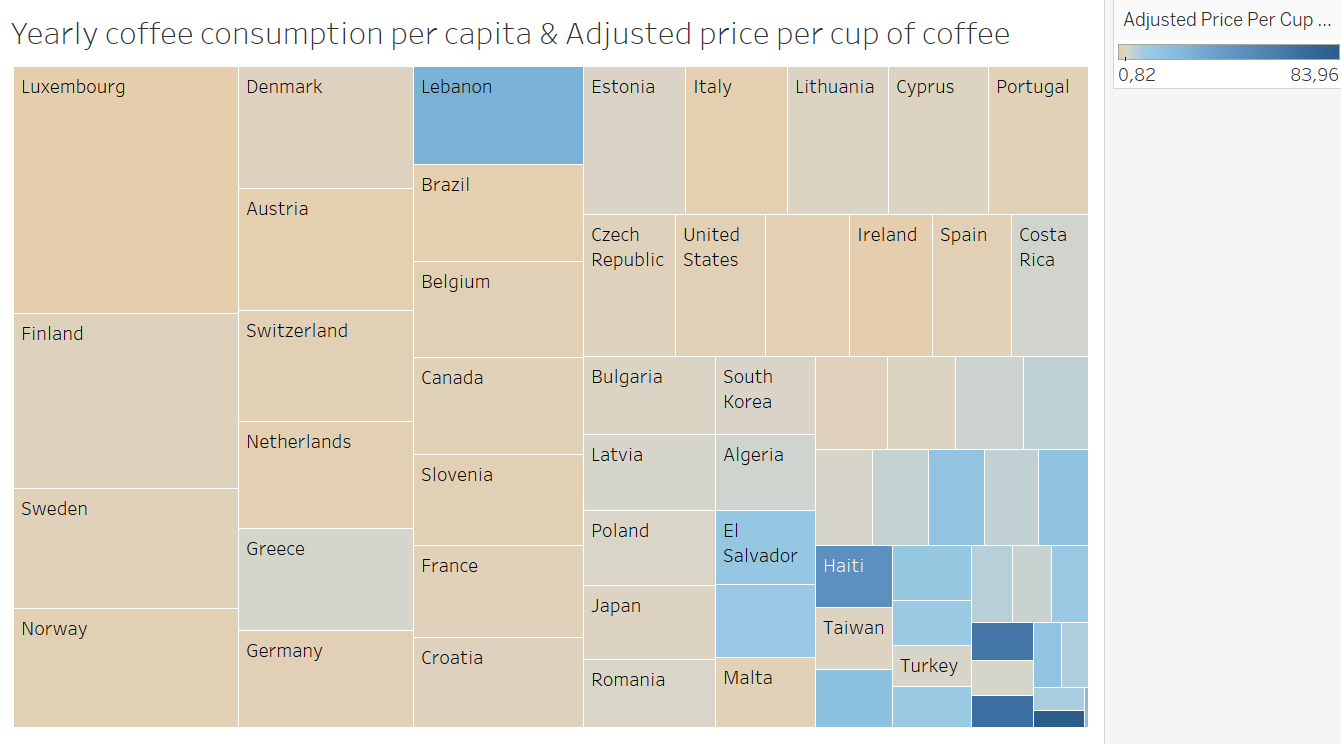
To better visualise the relationship between coffee consumption and affordability, this treemap uses size to represent consumption levels and color to indicate the adjusted price of coffee in each country.
Countries like Luxembourg, Finland, and Sweden show high levels of coffee consumption, given that their adjusted prices are relatively low.
Compared with countries that have similar levels of coffee consumption, Lebanon and Haiti stand out for their significantly higher adjusted coffee prices. In contrast, citizens in Malta, Taiwan, and Turkey benefit from more affordable coffee despite consuming relatively modest amounts.
3.2 Working hours
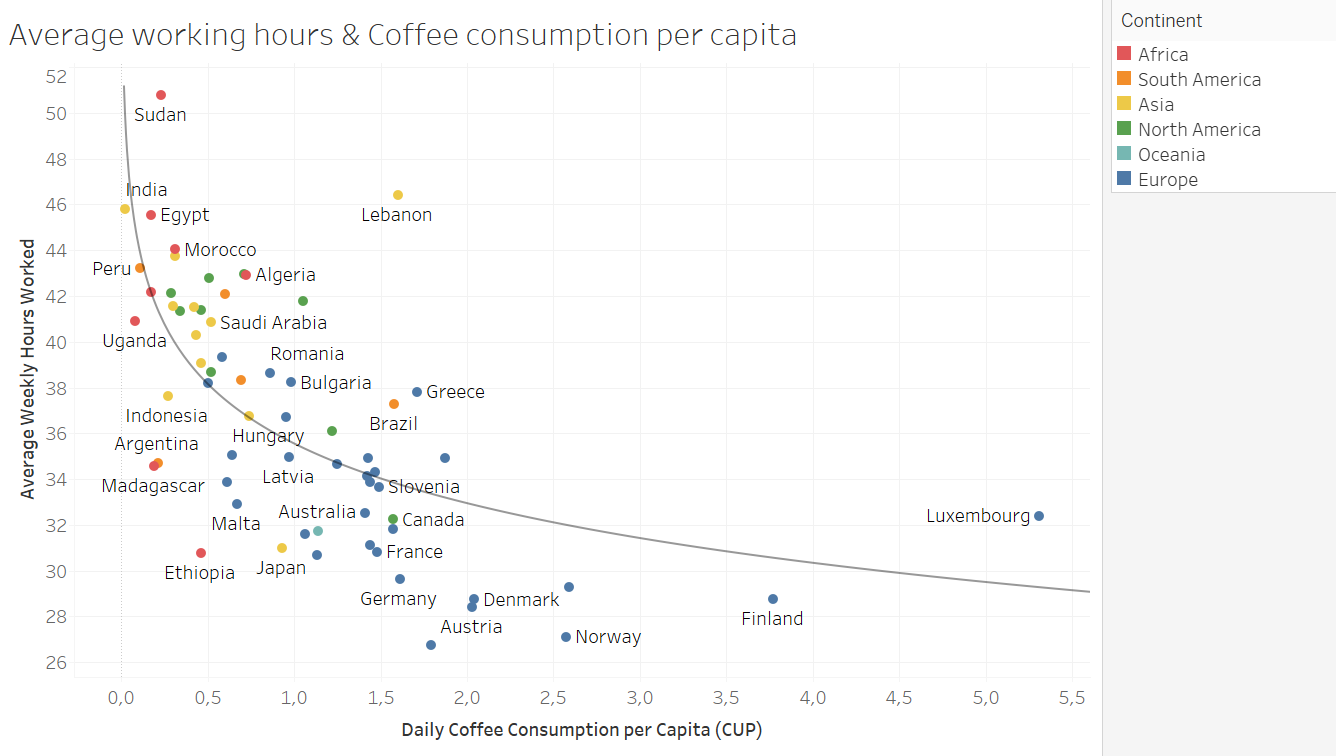
We initially assumed that longer working hours would lead to higher coffee consumption and set out to test this hypothesis using the data. However, the visualisation reveals a contrasting trend: countries with fewer average weekly working hours often consume more coffee, such as Luxembourg. Notably, high-income nations tend to have both high coffee consumption and shorter working hours. According to the OECD, these countries benefit from well-regulated labor markets, better work-life balance, and access to advanced productivity tools. Here, Lebanon stands out as an outlier, consuming more coffee than other countries with similar working hours.
3.3 Life expectancy
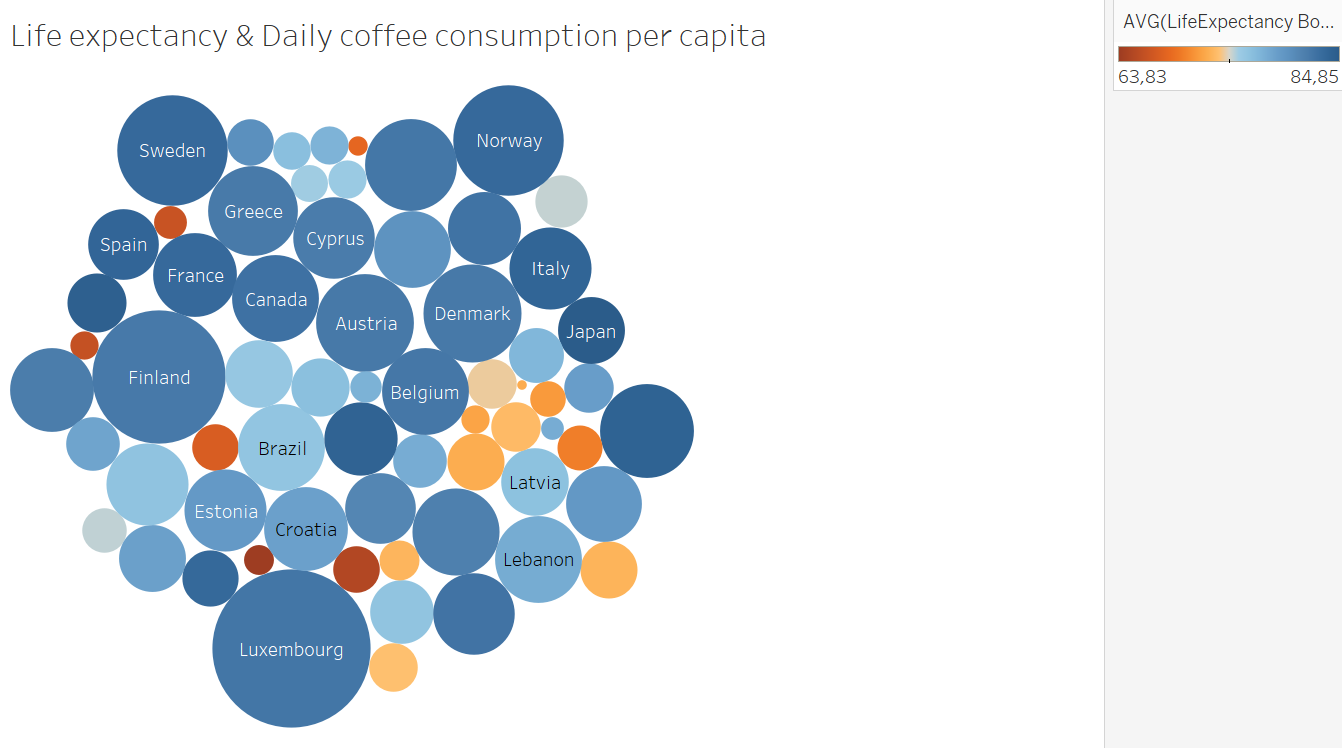
This bubble map offers a visual snapshot of the relationship between coffee consumption and well-being, where the size of each bubble corresponds to a country's coffee intake and its color reflects average life expectancy.
Data shows that countries with higher life expectancy often also report greater daily coffee consumption. While this might suggest a direct link, a closer examination reveals a more nuanced picture—life expectancy likely serves as a proxy for broader economic and social conditions, such as national wealth, healthcare quality, education, and overall lifestyle, which also correlate with relatively lower coffee price and accordingly, higher coffee consumption.
This pattern is clearly illustrated in the bubble chart: countries shaded in dark blue, indicating higher life expectancy, also tend to have larger bubbles, representing greater coffee intake. Notable examples include Luxembourg and Norway. From this perspective, in countries where people live longer due to favourable conditions, higher coffee consumption appears as a common accompanying trait rather than a causal factor.
4. Why Do We Need Coffee?
– Case Study: Coffee and Coding Efficiency in Lebanon
In our global coffee consumption analysis, Lebanon, as an outlier, is characterised by high adjusted coffee prices and long working hours, yet comparatively high consumption, raising an interesting question: why is coffee so important there? To explore this further, we look at a case study on how coffee might affect the coding efficiency of Lebanese programmers. This could help us better understand the role coffee plays in their daily lives.
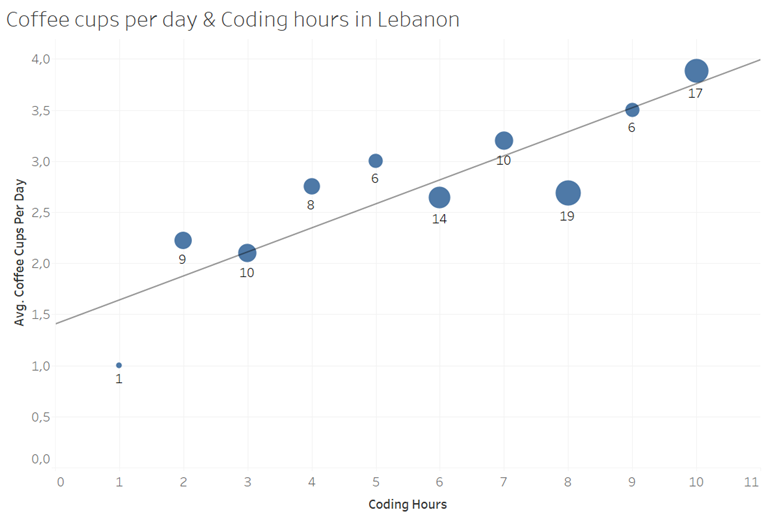
This graph explores the relationship between coding hours and coffee consumption among programmers in Lebanon, with each bubble's size representing the number of respondents in that category. As working hours increase, so does coffee intake, peaking at around 4 cups per day for those coding 10 hours daily. The data suggests a strong correlation between extended work sessions and higher caffeine consumption, likely used to maintain focus and productivity.
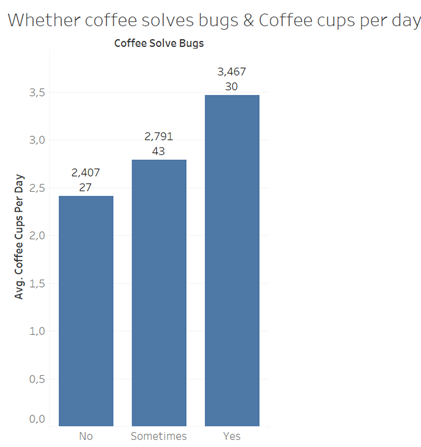
The graph presents programmers' perceptions on whether coffee helps solve coding bugs, correlated with their average daily coffee consumption. The data shows three distinct groups based on their belief in coffee's problem-solving abilities: "No," "Sometimes," and "Yes."
Notably, the heaviest coffee drinkers (averaging 3.467 cups per day) overwhelmingly believe coffee helps to solve bugs, while the most skeptical group (averaging just 2.407 cups) denies this effect. The middle group ("Sometimes") consumes a moderate amount (2.791 cups), suggesting a potential psychological or placebo effect, where those who drink more coffee may feel more confident in its cognitive benefits.
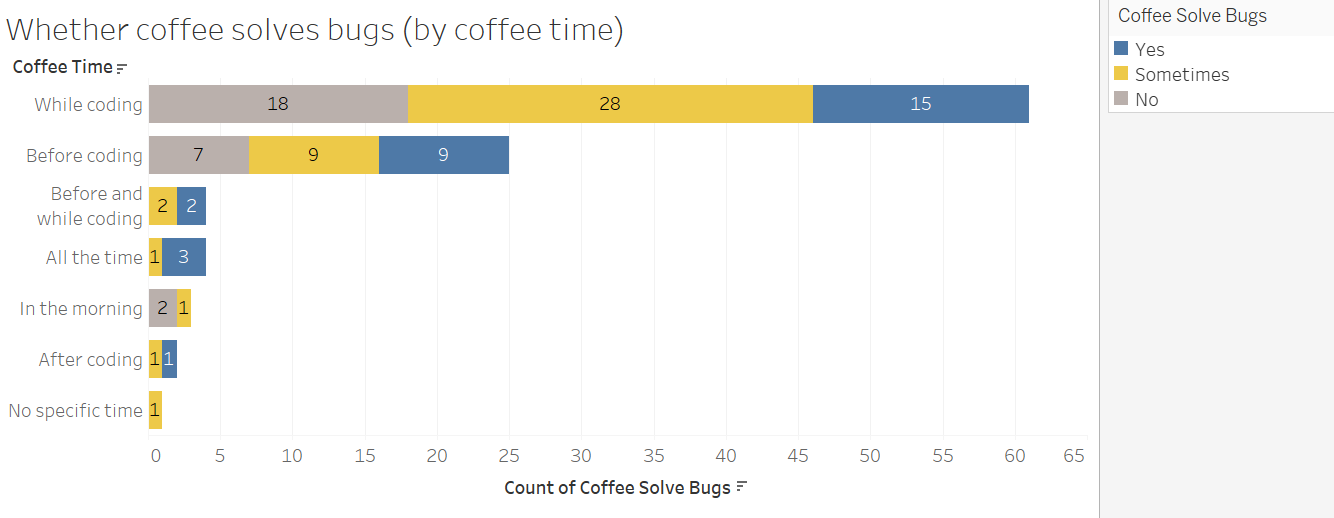
This data explores when programmers drink coffee and whether they believe it helps to solve coding bugs. Most drink coffee while coding, and a significant majority believe it helps them solve bugs - either consistently or occasionally, suggesting a link between real-time consumption and perceived productivity benefits.
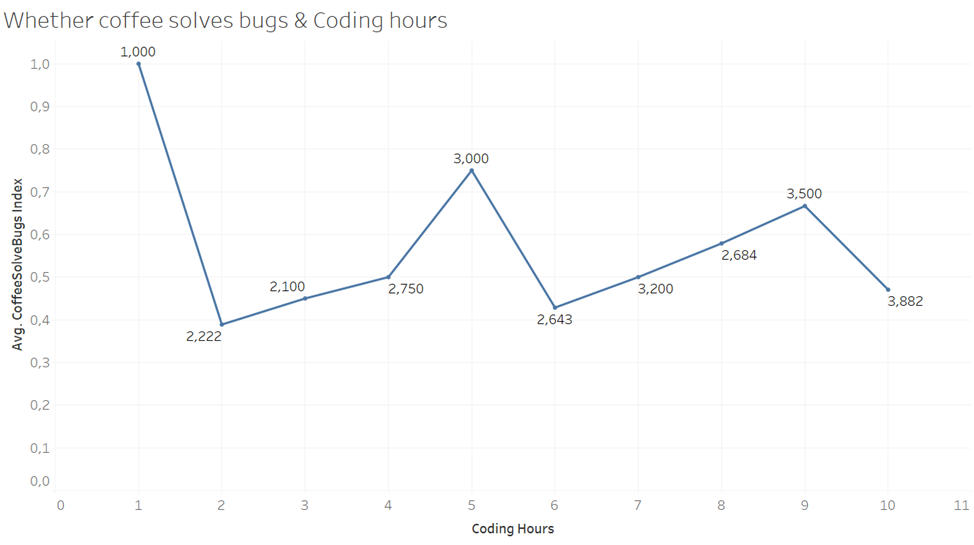
This graph reveals how programmers' belief in coffee's ability to help solve bugs (measured from 0 for "No", 0.5 for “Sometimes”, to 1 for "Yes") changes with their daily coding hours, with the label as coffee consumption in cups.
Coffee appears to be effective in boosting focus during shorter coding sessions. Within a reasonable timeframe, increased coffee consumption can still provide noticeable benefits. However, when coding stretches into long, intense periods — such as 10 hours — the effectiveness of coffee diminishes. At that point, mental exhaustion sets in, and caffeine alone is no longer enough to sustain productivity. This suggests that while coffee can support short to moderate workloads, it has clear limits when it comes to combating deep fatigue from prolonged coding.

Our talented members

Pan

Ya Chi

JiaJingLin Xie

Quang Hoang

Emma

Shuang Zhen
References
https://dataviz2023group1kul.netlify.app/
TIME, s.n., “COFFEE CRISIS GIVES WORLD MARKET THE JITTERS“, last accessed on April 22 2025, from https://time.com/archive/6919754/coffee-crisis-gives-world-market-the-jitters/.
Regulation (EU) No 978/2012 of the European Parliament and of the Council of 25 October 2012 applying a scheme of generalised tariff preferences and repealing Council Regulation (EC) No 732/2008, OJ L 303, 31.10.2012, blz. 1–82, http://data.europa.eu/eli/reg/2012/978/oj
Coffee : A Comprehensive Guide to the Bean, the Beverage, and the Industry, edited by Robert W. Thurston, et al., Rowman & Littlefield Publishers, Incorporated, 2013. ProQuest Ebook Central, http://ebookcentral.proquest.com/lib/kuleuvenul/detail.action?docID=1481220.
https://perfectdailygrind.com/2022/01/the-history-of-the-us-coffee-shop/#:~:text=The%20first%20mention%20of%20coffee,either%20Boston%20or%20New%20York.
Thurston, Robert W. Coffee : A Comprehensive Guide to the Bean, the Beverage, and the Industry. Edited by Robert W. Thurston et al., Rowman & Littlefield, 2013.
Morris, Jonathan. “Why Espresso? Explaining Changes in European Coffee Preferences from a Production of Culture Perspective.” European Review of History = Revue Européene d’histoire, vol. 20, no. 5, 2013, pp. 881–901, https://doi.org/10.1080/13507486.2013.833717.
Morris, Jonathan. “Why Espresso? Explaining Changes in European Coffee Preferences from a Production of Culture Perspective.” European Review of History = Revue Européene d’histoire, vol. 20, no. 5, 2013, pp. 881–901, https://doi.org/10.1080/13507486.2013.833717.
https://oajournals.fupress.net/index.php/rea/article/view/9839/9836
https://www-sciencedirect-com.kuleuven.e-bronnen.be/science/article/pii/S0306919206001187